Exploring Advanced Logging Controls for AWS Lambda
Posted on December 4, 2023 • 5 minutes • 922 words
Table of contents
Lambda Logging In a Nutshell
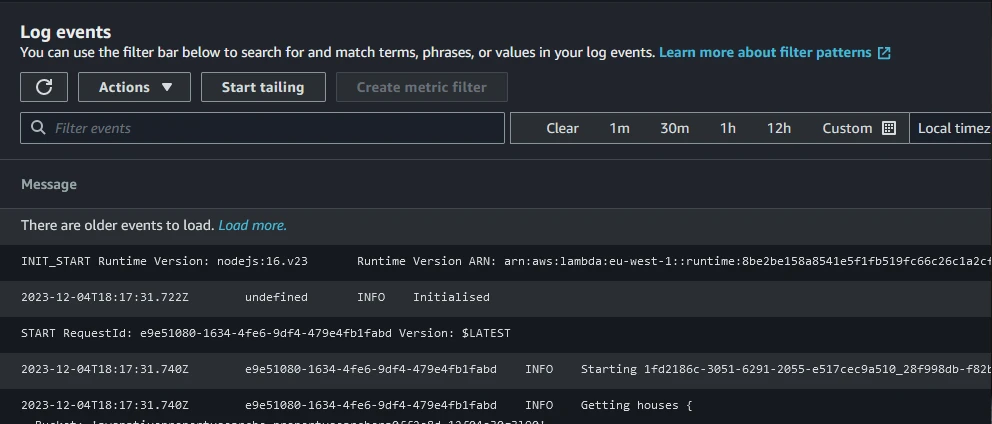
The default logging mechanism in AWS Lambda is straightforward: any output sent to standard out/error is redirected to the CloudWatch Logs service. There, it is stored within a log group named after the Lambda function (/aws/lambda/function-name). Within this group, there is a log stream, a string combining the date, function version, and the unique GUID of the function environment (YYYY/MM/DD[Function version][Execution environment GUID]). Environments can be reused, so it’s possible some streams have multiple invocations, and others just one.
The logs themselves contain the date, execution environment GUID, log level, and the log message in raw format.
Best Practices
The best practices for logging include several points relevant to the new advanced logging controls:
- Use structured logging. For example, logging in JSON format allows for easier filtering and parsing.
- Utilise log levels and configure them per environment. It’s useful to log debug data in development environments, but not appropriate in production, either due to the sheer volume of data or because it might contain personally identifiable information.
- Log context. It’s useful to log that an error occurred, but logging contextual information, such as user IDs and configuration values, can be even more helpful.
Advanced Logging Controls
From the official AWS blog , there are a few extra features included:
- Native support for logging in a structured JSON format.
- Support for configuring log granularity, allowing setting of application and system log levels from TRACE and DEBUG up to FATAL.
- The ability to customize the function’s CloudWatch log group for use, allowing multiple functions to log to the same group (the log stream now includes the function name).
Powertools for AWS Lambda
If you haven’t heard of Powertools for AWS Lambda before, it’s well worth a look. It’s a toolkit that can be added to your functions to assist in implementing best practices. This includes features such as easy ways to use metrics, add idempotency, and enable tracing. One of the major features of this toolkit is the Logger .
The logging feature within Powertools adds capabilities for structured logging, such as in JSON, and for log levels. There are also helpers to capture context and facilitate log sampling.
Comparing Logging Methods
Traditional Logging
Using traditional logging of strings, along with log levels (such as console.debug/info/error), outputs the following (ignoring platform logs for now):
2023-12-05T19:39:16.935Z	0f97852eac2f	DEBUG	Starting work for customer 5003
2023-12-05T19:39:16.943Z	0f97852eac2f	INFO	Customer account not found, creating new one
2023-12-05T19:39:16.943Z	0f97852eac2f	ERROR	Error creating customer account
2023-12-05T19:39:16.943Z	0f97852eac2f	DEBUG	Finished work
This is suitable for manual reading of the log, but has two main issues:
- It’s challenging to locate specific logs for a certain customer, especially since the first log contains the ID in an unstructured form, and the others do not.
- Debug, info, and error logs are output in every environment, regardless of settings.
Advanced Logging Controls
Under configuration, there is now a new section that can be updated:
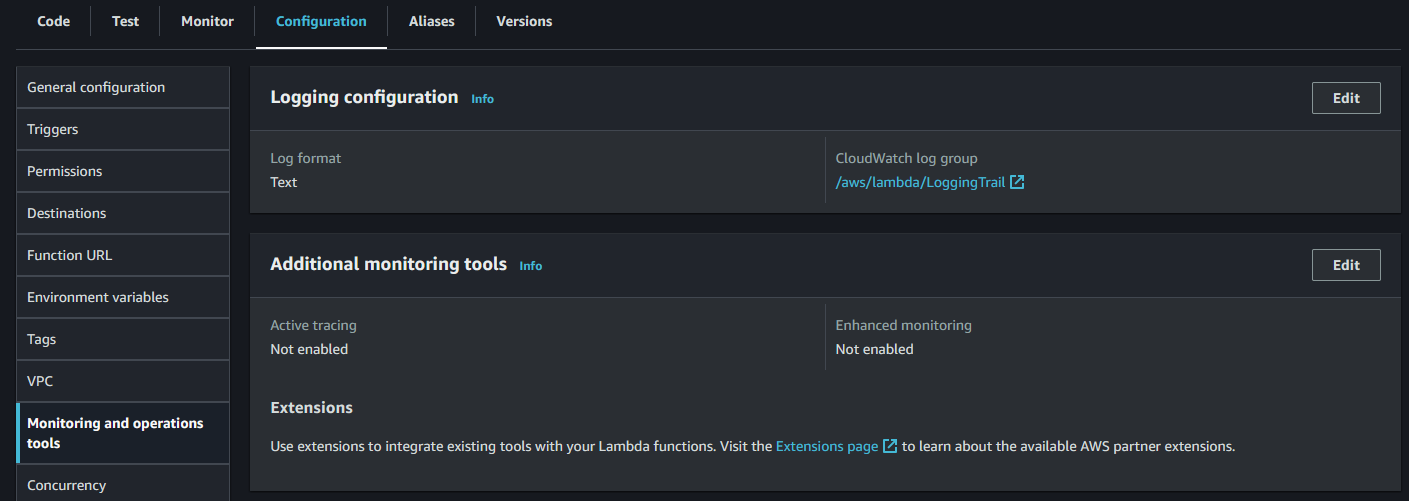
Editing this section to change from text to JSON reveals additional options:
- Application log level, defaulting to INFO.
- System log level, also defaulting to INFO. These are the platform logs output by the Lambda runtime.
Let’s test the same code with this configuration enabled at the INFO level.
{
    "timestamp": "2023-12-05T19:46:14.499Z",
    "level": "INFO",
    "requestId": "fd356389-6ba7-44ea-b75f-4a7a660881b7",
    "message": "Customer account not found, creating new one"
}
{
    "timestamp": "2023-12-05T19:46:14.510Z",
    "level": "ERROR",
    "requestId": "fd356389-6ba7-44ea-b75f-4a7a660881b7",
    "message": "Error creating customer account"
}
Now, only INFO and ERROR logs are output, but the customer ID is still missing. However, we can slightly modify our code:
// from
console.info("Customer account not found, creating new one");
// to
console.info({ "message": "Customer account not found, creating new one", "customer": 5003 });
This change yields the result:
{
    "timestamp": "2023-12-05T19:54:32.065Z",
    "level": "INFO",
    "requestId": "f33b2dae-ade8-4665-81be-bc58b319b832",
    "message": {
        "message": "Customer account not found, creating new one",
        "customer": 5003
    }
}
{
    "timestamp": "2023-12-05T19:54:32.078Z",
    "level": "ERROR",
    "requestId": "f33b2dae-ade8-4665-81be-bc58b319b832",
    "message": {
        "message": "Error creating customer account",
        "customer": 5003,
        "error": "NaN"
    }
}
This format makes it much easier to filter logs and allows for contextual information in each log entry. This can be achieved using destructuring to manage common fields in one place:
const logProps = {
    "customer": 5003
};

console.debug({ "message": "Starting work", ...logProps });
Powertools for AWS Lambda
To utilise Powertools for AWS Lambda, the library must be installed in the project. Key fields and features can be managed through environment variables, such as:
- POWERTOOLS_LOG_LEVEL
- POWERTOOLS_LOGGER_SAMPLE_RATE (a probability between 0-1 that all logs are output, regardless of the level)
- POWERTOOLS_LOGGER_LOG_EVENT (to log the raw event)
With proper setup, each log event can include context, like the function name, request ID, etc. Custom context (like customer ID) can be added with a function call.
Ultimately, the log events appear similar to the above JSON output events but with different fields, depending on the configuration and setup.
My Overall Thoughts
If you are using Powertools for AWS Lambda, continue to do so. The new features for JSON logging and log levels might not be necessary, and it’s not worth removing Powertools to use the native support, especially since Powertools offers more capabilities.
If you aren’t using Powertools, these new features are a welcome addition. They allow you to align with best practices more quickly, and I see no reason not to use them.
Regarding the shared log-group option, I can see how this could be really useful for grouping together multiple functions that make up a single application. It would be even more useful if the same stream could be used, allowing for tailing all logs across all function instances.